Understand your
database at a glance
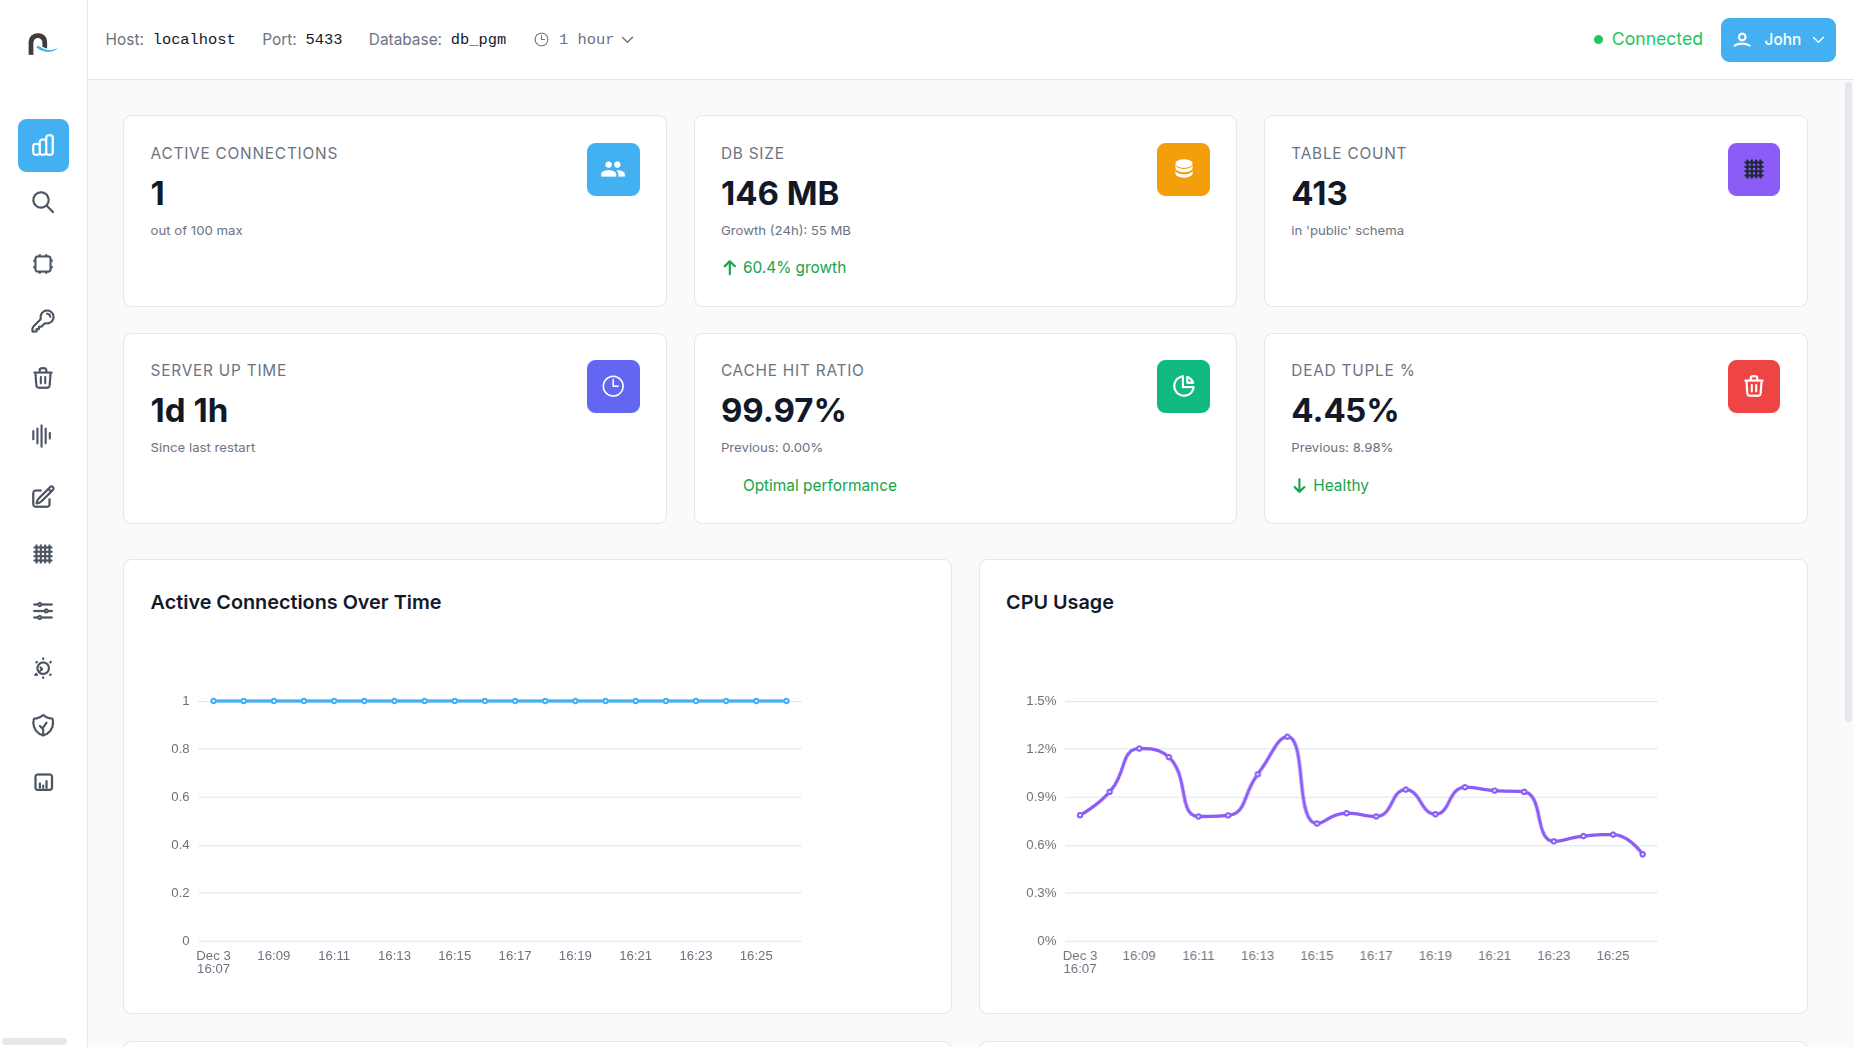
Get a complete snapshot of PostgreSQL health with metrics for growth, uptime, connections, cache efficiency, and live activity trends giving you fast clarity on overall system stability.
Compare query
plans with total clarity
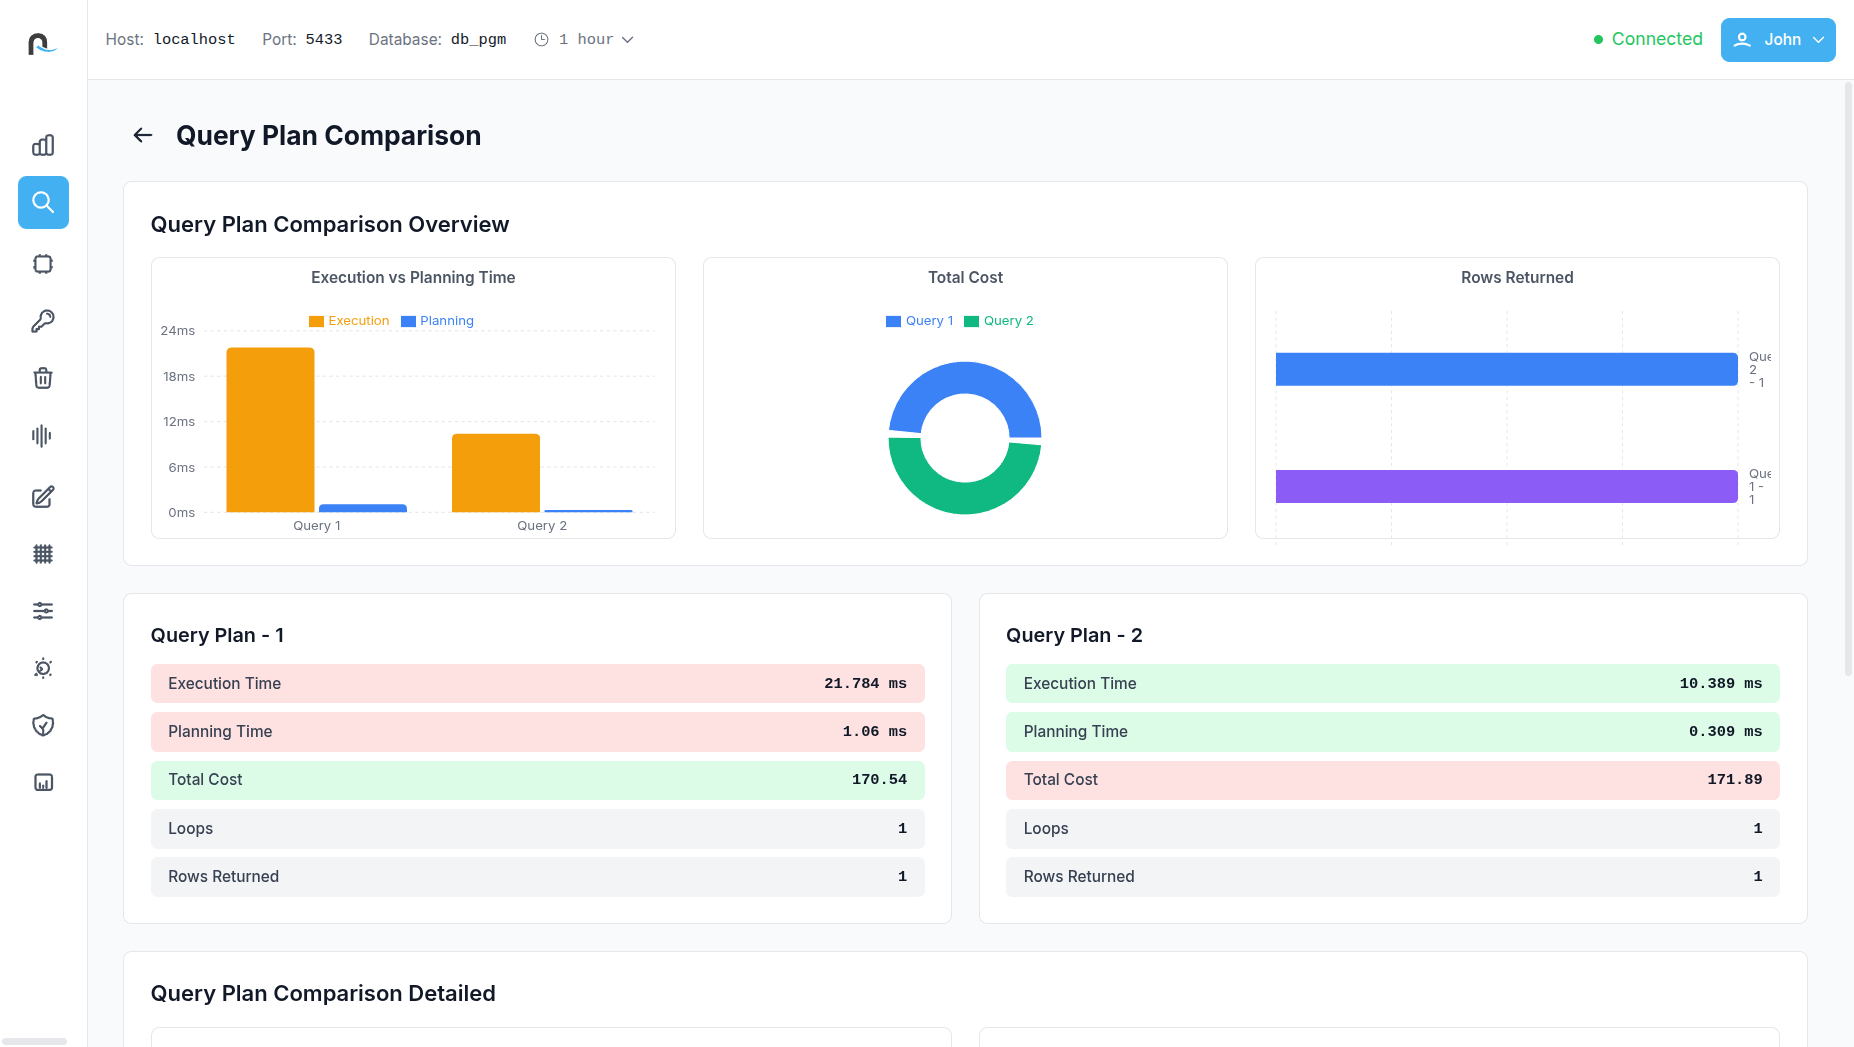
Visually and numerically compare two execution plans to see how changes affect cost, runtime, loops, and row processing, helping you validate optimizations with confidence.
Improve performance
with index suggestions
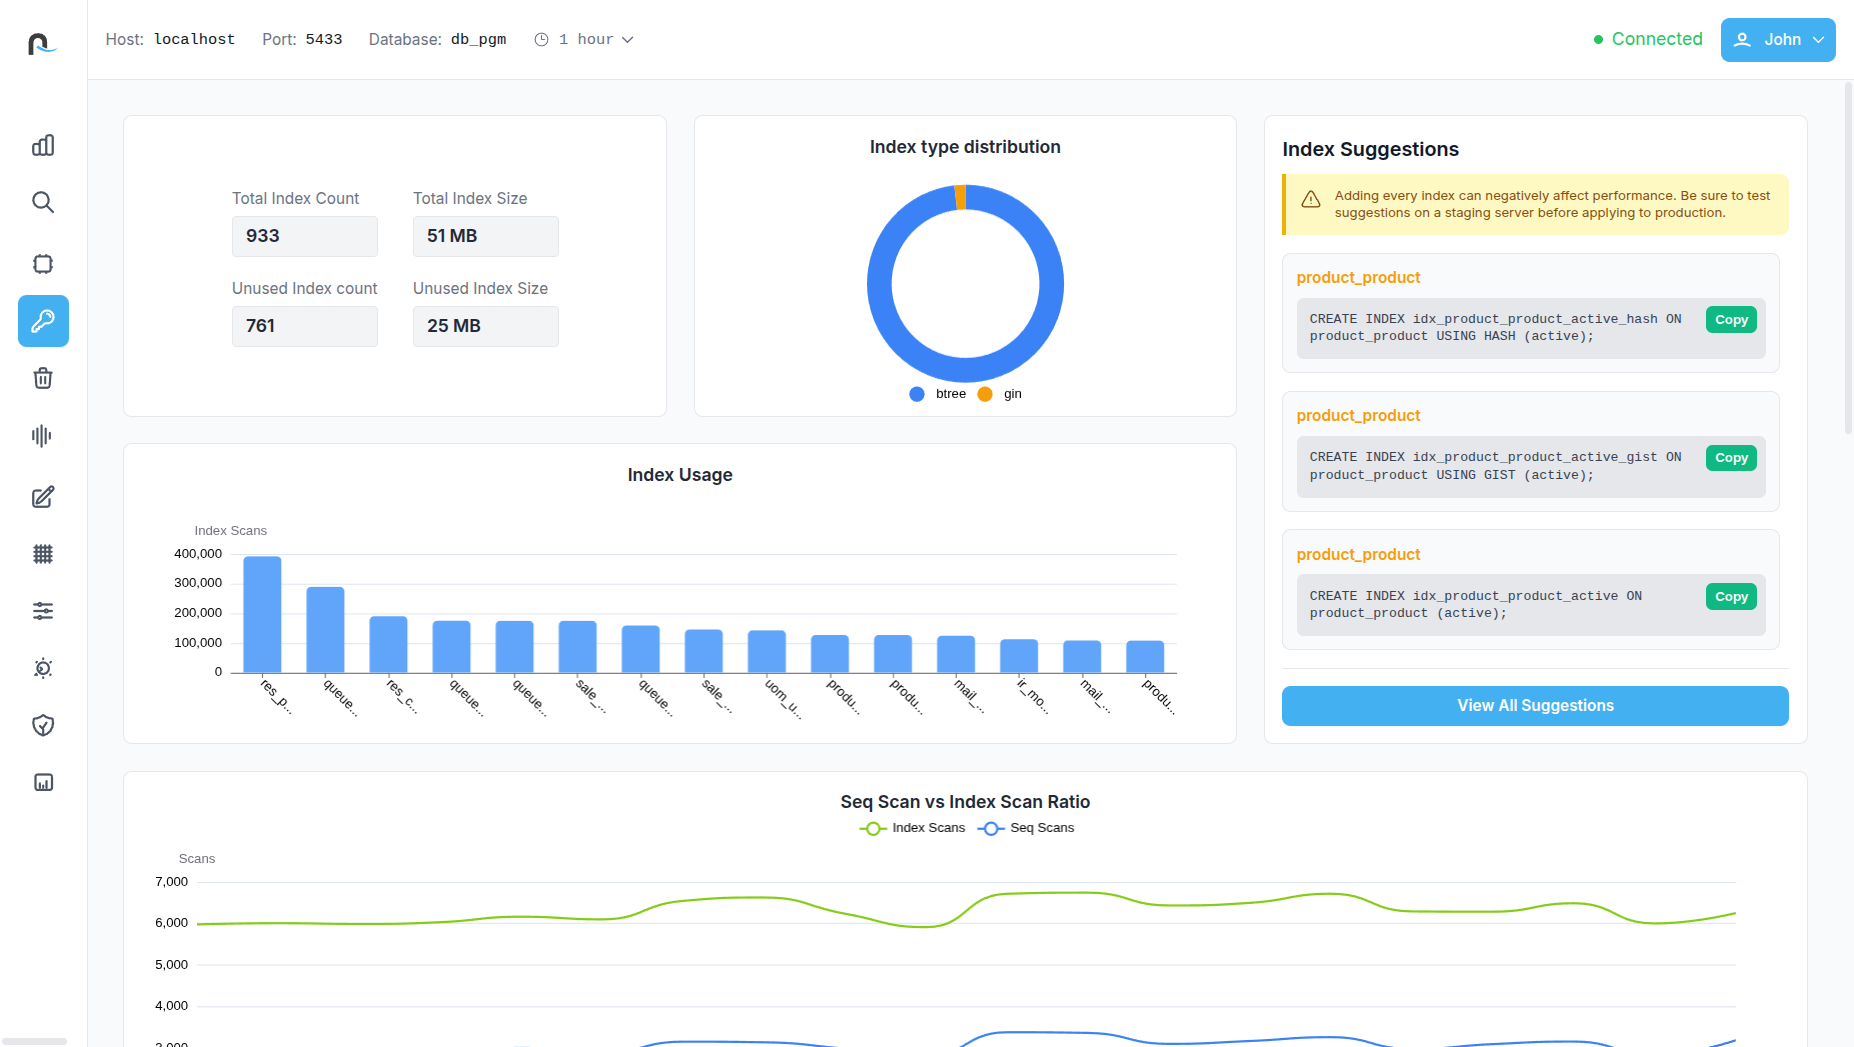
Review deep index usage statistics, unused index candidates, scan ratios, and storage impact paired with clear, actionable recommendations for cleaner, more efficient indexing.

Optimize table health
with vacuum insights
Track autovacuum activity, dead tuple patterns, and disk usage impact to ensure timely maintenance, reduce bloat, and maintain optimal table performance.

Dive Deeper with
Comprehensive Insights
Access expert-level metadata on constraints, foreign key relationships, partition structures, triggers, JIT compilation stats, table storage layout, and tablespace usage for complete system transparency.
Unlock the Complete
Performance Picture of PostgreSQL.
Database Insight Panel
PGTuner provides a comprehensive snapshot of your database’s overall health, giving teams instant visibility into active connections, database size and its growth rate, table count, server uptime, cache hit ratio, and dead tuple percentage. It also includes rich visualizations—such as active connections over time, CPU utilization trends, cache hit ratio trajectories, and transaction statistics per table. This consolidated view helps identify early warning signs, monitor workload patterns, and maintain a consistently healthy PostgreSQL environment.
Slow Query Analysis
The tool offers a deep dive into critical performance indicators like backend xmin/xid age, the oldest active query, transaction, and backend age. It visually highlights slow queries, top queries by average execution time, disk I/O per query, and query distribution by type. PGTuner also provides a detailed breakdown of slow queries, enabling users to quickly identify inefficient workloads, pinpoint the exact query causing delays, and prioritize optimization efforts with clarity.
Visual Query Plan Breakdown
With a single click, complex execution plans are transformed into an intuitive visual tree. Every execution node—Sequential Scans, Index Scans, Nested Loops, Hash Joins, Join Filters, and more—is clearly represented with associated tables, filters, and conditions. This readable visual flow helps developers quickly spot performance bottlenecks such as slow scans, expensive loops, or poorly optimized joins, making plan interpretation significantly easier and more actionable.
Query Plan Comparison Panel
PGTuner allows users to compare two query plans in a structured, visual format to understand how changes in indexing, filters, or query structure impact performance. The comparison highlights differences in planning time, execution time, total cost, loops, and rows processed. A visual diff of plan nodes makes improvements—or regressions—instantly visible. This gives teams the confidence to validate optimizations before deploying them into production.
Query Waits & Resource Usage
Reveals real-time query waits, helping teams identify blocked or waiting operations instantly. It also highlights the top queries by total I/O usage, provides detailed resource consumption over time, and offers refined views of current query activity. Users can explore PostgreSQL’s query wait distribution and I/O usage breakdowns to better understand which workloads are consuming the most disk, CPU, and memory resources.
Deep Index Analysis
The Index Analysis dashboard provides visibility into total index count, index size, unused indexes, and their storage impact. It includes usage graphs, index type distribution, and a comparison of sequential scan versus index scan ratios. PGTuner also offers automatic index recommendations, highlights unused or redundant indexes, and displays full index definitions—helping users improve performance and reduce unnecessary storage consumption.
Detailed Vacuum Analysis
This section focuses on table health and storage efficiency by showing dead tuple trends per table, vacuum activity over time, total disk writes caused by vacuum operations, and the latest autovacuum timestamps. It also reports total dead tuple counts and lists current vacuum-related configuration parameters along with their active values. These insights make it easier to fine-tune autovacuum settings and maintain optimal table performance.
In Depth Table Analysis
Table Analysis provides a clean, high-level snapshot of your table’s overall health and performance. It highlights essential metrics such as index scan ratio, write activity, dead tuple percentage, hot update efficiency, and fill factor, giving you an instant understanding of how well the table is optimized. Visual charts break down scan types and row operations, while quick-access stats reveal table size, index size, and bloat levels.
Query Plan Explorer
PGTuner’s Query Plan Explorer displays a list of queries along with key performance metrics such as highest execution time, highest planning time, and total rows processed. This feature includes visual graphs showing query call frequency and a performance distribution chart comparing planning time versus execution time. From the explorer, users can easily open and inspect detailed query plans for deeper analysis, making it easier than ever to understand how PostgreSQL executes each request.
Overall Resource Consumption
PGTuner visualizes resource usage across WAL generation, temporary file creation, total I/O operations, and CPU activity. It also lists the most resource-intensive queries with detailed metrics, enabling developers and DBAs to understand which operations consume the most system capacity. These insights help in workload planning, performance optimization, and preventing resource exhaustion before it affects the application.
Advanced Insights
The Advanced Insights unlocks deep, low-level information about the database, helping administrators understand system behavior with exceptional detail. It includes views like query load by user, foreign key lists and relationships, function usage statistics, constraint details, event triggers, primary key metadata, partition table breakdowns (with size and conditions), and materialized view definitions with storage usage. Users can also explore disk usage per tablespace, physical data file mapping, low-level storage details for relations, extension catalogs, JIT compilation statistics, and temporary file write metrics. This powerful collection of insights supports advanced troubleshooting, auditing, and system optimization.
Write Activity Analysis
The Write Activity Analysis dashboard provides a clear, data-rich view of how write-heavy operations impact your PostgreSQL database. It summarizes total inserts, updates, and deletes, while offering deep insights into HOT updates, overall update volume, and the HOT update ratio, helping you understand how efficiently PostgreSQL is minimizing index rewrites. This section visualizes WAL generation, WAL records, and full-page writes to reveal how write operations translate into storage and I/O load. Interactive charts compare WAL activity with actual disk writes and show trends in row modifications over time. Detailed tables break down write activity per table including live and dead rows also highlight HOT update behavior across the schema.
Transaction & Lock Analysis
The Transactions & Locks Analysis gives a complete view of how transactions behave inside your PostgreSQL system. It displays the active transaction count, highlights ongoing lock conflicts, and provides an overview of transaction health through commit - rollback trends and ratio fluctuations. Visual timelines show transaction states over time, while lock distribution charts reveal which lock types dominate system activity. Users can drill down into active transactions to see PID details, duration, and a preview of the running query. The detailed lock analysis table further identifies blocked and blocking sessions, associated users, wait events, and wait durations—making it easy to diagnose contention issues and resolve performance bottlenecks quickly.
Data Access Insights
The Data Access Insights section offers a clear breakdown of how frequently tables and indexes are accessed and modified. It presents total table operations, index scan counts, dead rows, and bloat percentages to help assess table health and storage efficiency. Time-based graphs visualize table operations and compare sequential scans against index scans, enabling users to track access patterns and detect suboptimal query behavior. Detailed activity tables provide per-table insights into reads, writes, and row changes, while the index usage breakdown highlights which indexes are actively used and which may be redundant. This feature helps teams optimize query performance, reduce bloat, and ensure indexing strategies match real-world workloads.
Wait Events Analysis
The Wait Events Analysis dashboard provides deep visibility into what your PostgreSQL sessions are waiting on and why performance slowdowns occur. It highlights total active waits, the most common wait type, and alerts you to critical waits that exceed threshold durations. A real-time timeline visualizes wait events—Client, I/O, or Lock—helping you quickly spot spikes in contention or stalled operations. The dashboard summarizes current wait distribution and average wait duration, making it easy to assess overall system responsiveness. For deeper diagnostics, a detailed list of active waiting sessions shows each session’s PID, user, precise wait event, duration, and state. This enables DBAs and developers to identify blocking operations, troubleshoot bottlenecks, and maintain consistently high performance.
Config Parameter Panel
The Config Parameter Panel section provides a complete, organized view of every setting defined in the postgresql.conf file. It displays each parameter alongside its current value, a clear explanation of its purpose, and an indication of whether a server restart is required for changes to take effect. This gives you full transparency into your database configuration, helping them understand performance-impacting settings, identify misconfigurations quickly, and manage tuning decisions.
Maintenance Progress
The Maintenance Progress section provides a real-time snapshot of all maintenance operations currently running in your PostgreSQL environment. It highlights key activities such as ongoing ANALYZE and VACUUM operations, clustering tasks, active COPY commands, base backups, and index creation processes. The feature consolidates progress data from all pg_stat_progress_* views into a clear, unified table, showing the host, port, database, refresh interval, timestamp, and user responsible for each operation. This gives you full visibility into background tasks, helping you understand workload pressure, monitor long-running routines, and ensure maintenance is progressing smoothly across your databases.